I’ve been eager to work on a project involving time series databases. With summer heating up the northern hemisphere, I recently had the idea to create a small project at home to monitor the temperature of the two Pis I have.
Since the configurations of the two devices I have are different (Pi4 - Pi Zero), I planned to write the script that measures temperature data in shell script to find a common ground. This shell script would run every minute and send the results to an InfluxDB on a remote machine.
As I had never written a shell script before, I turned to our dear friend GPT for help. After a few attempts, I managed to obtain the exact script I wanted.
#!/bin/bash

# Determine the node name based on hostname
NODE=$(hostname)

# InfluxDB settings
INFLUX_URL="your_influx_db_host"
INFLUX_TOKEN="your_influx_token"

# Function to get CPU temperature
get_cpu_temp() {
  vcgencmd measure_temp | grep -oP '\d+\.\d+'
}

# Function to get GPU temperature (if available)
get_gpu_temp() {
  vcgencmd measure_temp | grep -oP '\d+\.\d+' 2>/dev/null || echo "N/A"
}

# Get CPU temperature
CPU_TEMP=$(get_cpu_temp)

# Get GPU temperature
GPU_TEMP=$(get_gpu_temp)

# Epoch timestamp in nanoseconds
EPOCH_NANO=$(date +%s%N)

# Print date and time
echo "Current date and time:"
echo "----------------------"
echo "$(date)"

# Construct data to send to InfluxDB
DATA="temp,node=${NODE} cpu_temperature=${CPU_TEMP} ${EPOCH_NANO}"
if [ "$GPU_TEMP" != "N/A" ]; then
  DATA+=$'\n'"temp,node=${NODE} gpu_temperature=${GPU_TEMP} ${EPOCH_NANO}"
fi

# Print the data to be sent
echo -e "\nData to be sent:"
echo "----------------"
echo -e "$DATA"

# Send data to InfluxDB
echo -e "\nSending data to InfluxDB..."
curl --request POST \
  --url $INFLUX_URL \
  --header "Authorization: Token ${INFLUX_TOKEN}" \
  --header "Content-Type: text/plain; charset=utf-8" \
  --header "Accept: application/json" \
  --data-binary "$DATA"

echo "Data successfully sent to InfluxDB."
Current date and time:
----------------------
Thu Jul 18 13:49:09 +03 2024
Data to be sent:
----------------
temp,node=pi4 cpu_temperature=53.5 1721299749389821197
temp,node=pi4 gpu_temperature=53.5 1721299749389821197
Sending data to InfluxDB...
Data successfully sent to InfluxDB.The script is running smoothly 😄
Let’s add the script to cron jobs to run once every minute.
crontab -eLet’s use the nano editor to append the following line to the end of the opened file.
* * * * * /bin/bash /home/kaan/scripts/temp_info.sh >/dev/null 2>&1When I check the cron logs, I can see that our file is running even though there are no error or success messages.
journalctl _COMM=cron | grep temp_infoJul 17 12:25:01 pi4 CRON[2098647]: (kaan) CMD (/bin/bash /home/kaan/scripts/temp_info.sh >/dev/null 2>&1)
Jul 17 12:26:01 pi4 CRON[2098707]: (kaan) CMD (/bin/bash /home/kaan/scripts/temp_info.sh >/dev/null 2>&1)
Jul 17 12:27:01 pi4 CRON[2098785]: (kaan) CMD (/bin/bash /home/kaan/scripts/temp_info.sh >/dev/null 2>&1)Let’s check the data flow in InfluxDB
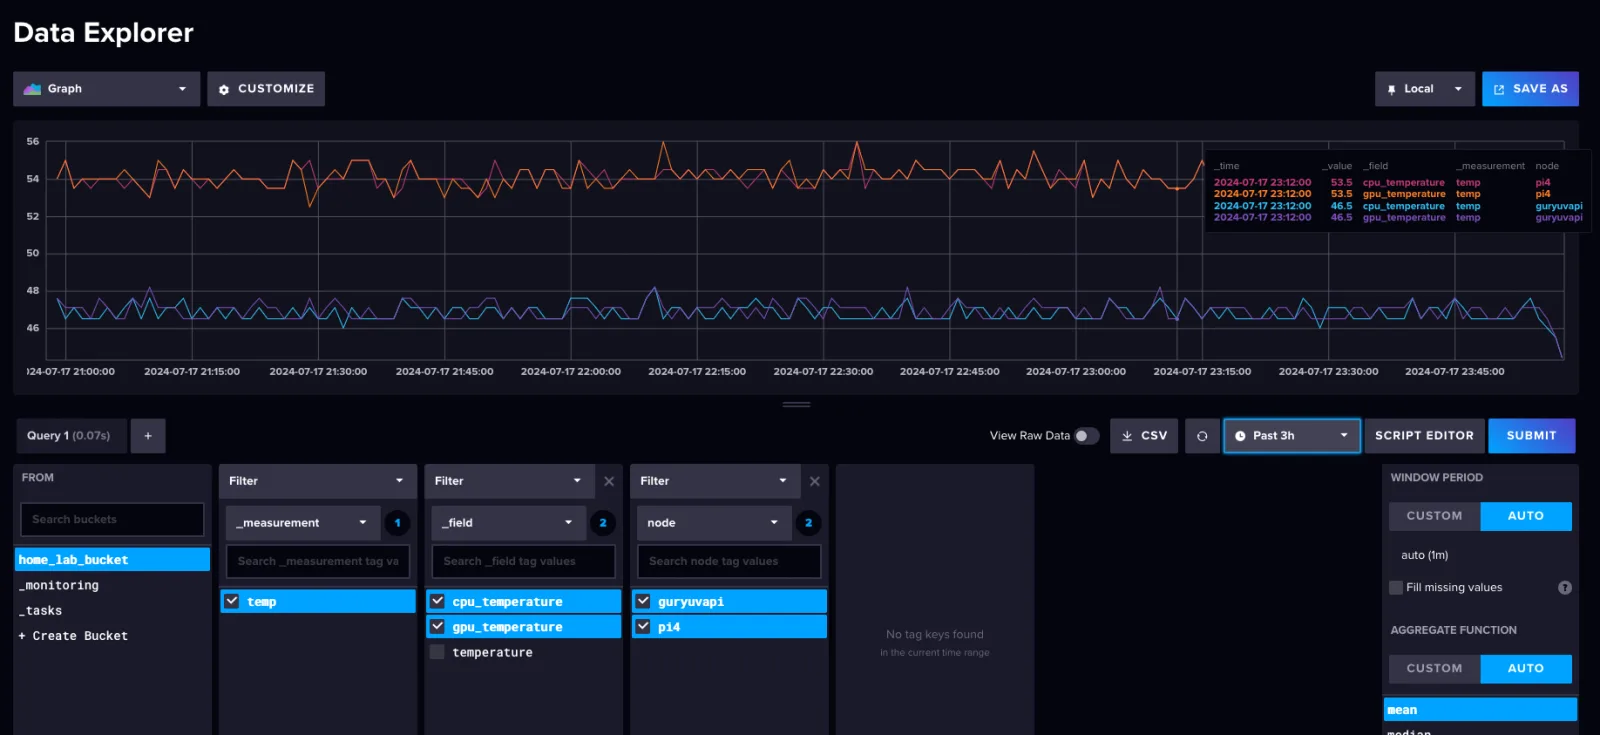
Everything looks good. Let’s move on to the visualization part.
Data visualization with Grafana
Let’s add Influx, our data source, to Grafana and write a few queries using Flux.
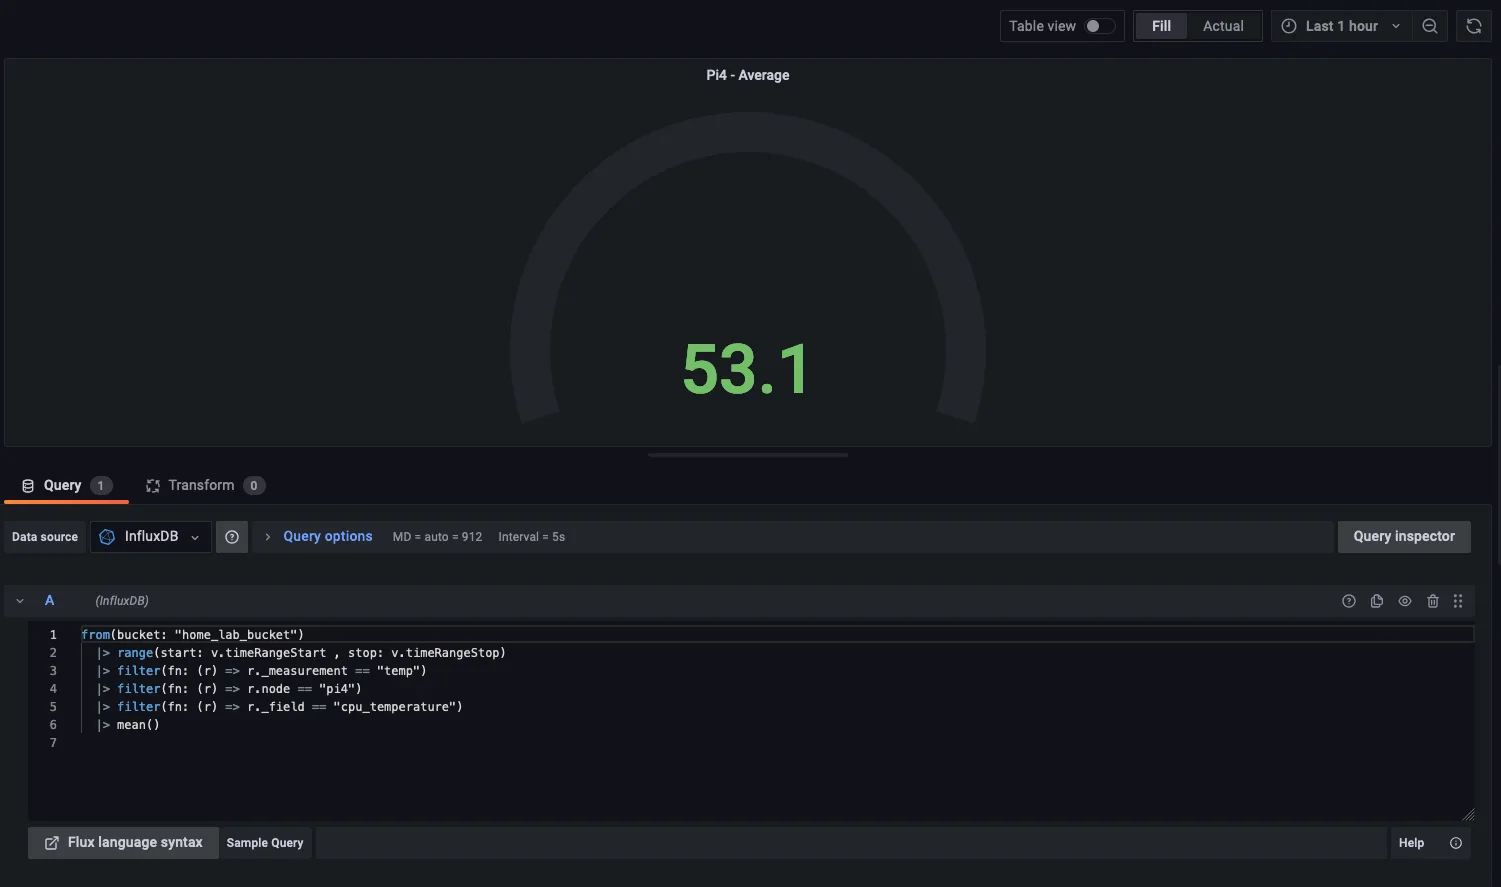
from(bucket: "home_lab_bucket")
  |> range(start: v.timeRangeStart , stop: v.timeRangeStop)
  |> filter(fn: (r) => r._measurement == "temp")
  |> filter(fn: (r) => r.node == "pi4")
  |> filter(fn: (r) => r._field == "cpu_temperature")
  |> mean()
The part that gave me a bit of trouble here was adding the selected time range information from Grafana to the query. The variables v.timeRangeStart and v.timeRangeStop seamlessly incorporated the selected date-time information from Grafana into the query.
Let’s add a few useful panels to our Grafana dashboard.
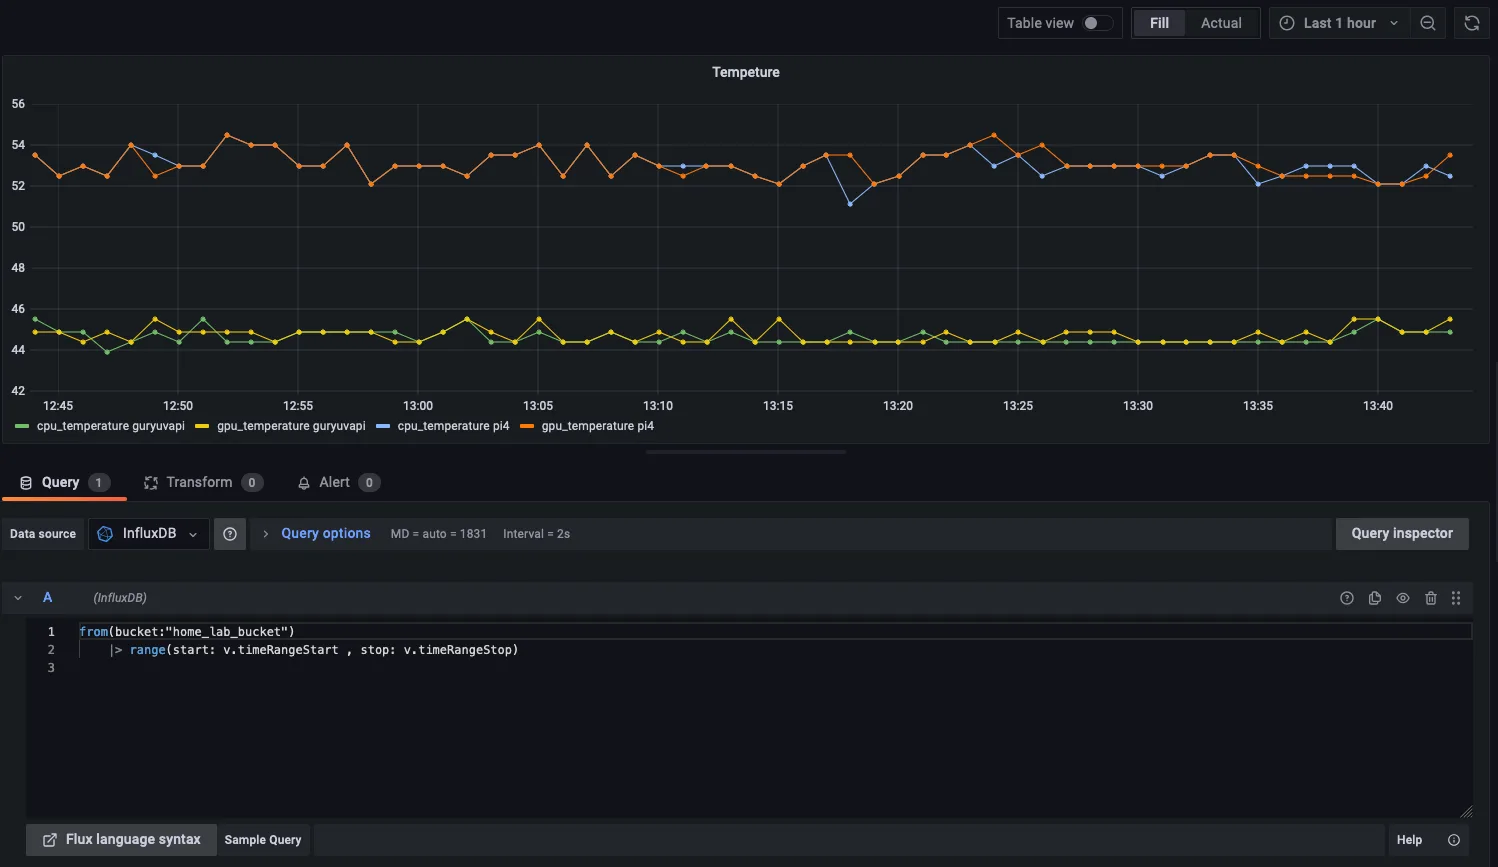
from(bucket:"home_lab_bucket")
    |> range(start: v.timeRangeStart , stop: v.timeRangeStop)
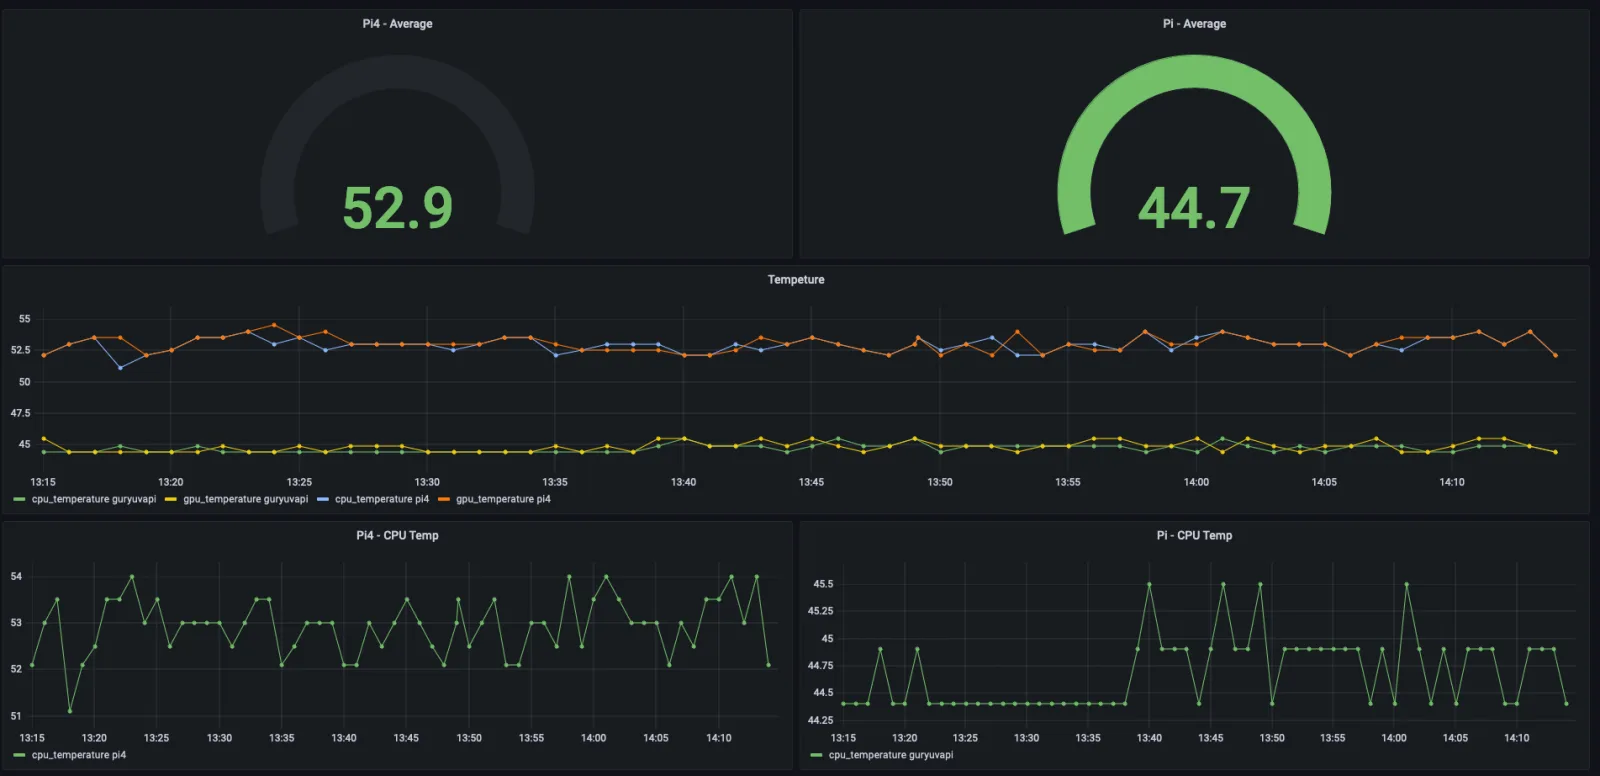
With a few hours of effort, I successfully created a simple dashboard just as I wanted.
Until the next post, see you soon!